The sponsorship industry is constantly evolving, as leagues and properties explore new and innovative ways to deliver value to their partners. One of the most significant innovations that captured the attention of fans, teams, and sponsors alike was the introduction of Digitally Enhanced Dasherboards (DEDs) during the 2022-23 NHL season.
The DED has allowed for more creative, dynamic, and flexible activation opportunities for teams and brands alike. However, to accurately measure the performance of this new asset, it is important to consider the qualitative and quantitative benefits and costs. In the next installment of our content series on DEDs, we compare and contrast the DED and Static Dasherboard, explore the pros and cons of each DED activation strategy, and the performance of the DED in its inaugural season.

Static and DED Differences
In previous seasons, NHL club and league sponsors were displayed as static advertisements around the perimeter of the rink. These advertisements are permanent and visible throughout the entire course of a game. Additionally, these static dasherboards continue to be visible to all fans that are attending the game in person.
The introduction of the DED allows for sponsors to be virtually overlaid on different broadcast feeds. This technology introduces more creativity and flexibility than ever before, with sponsors having the ability to update creative easily on a game-by-game basis.
In looking at the opening night broadcasts from the 2021-22 season and the 2022-23 season, we can see some of the immediate benefits of the DED in action:
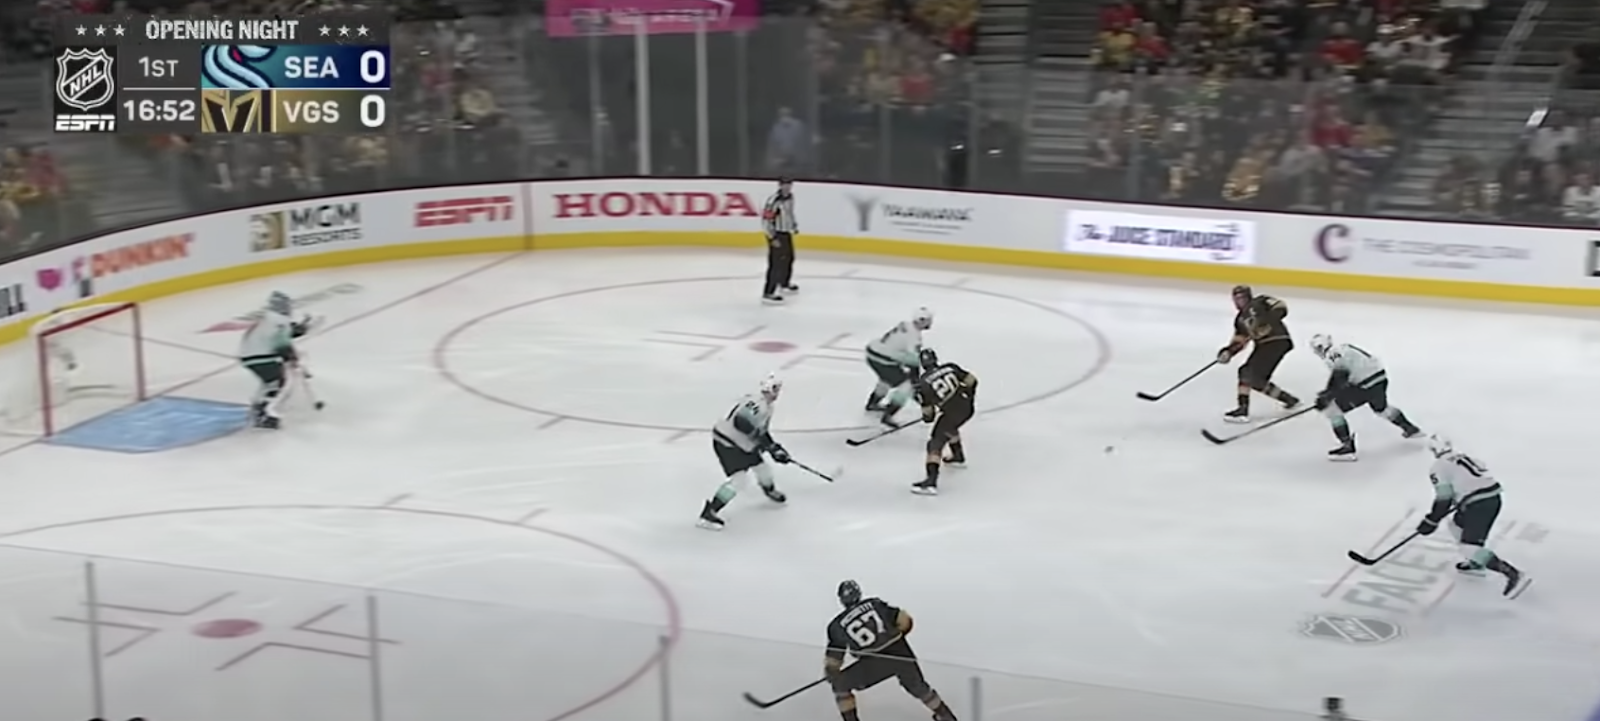
Seattle Kraken vs. Vegas Golden Knights - 10/12/2021
Static and LED Dasherboards
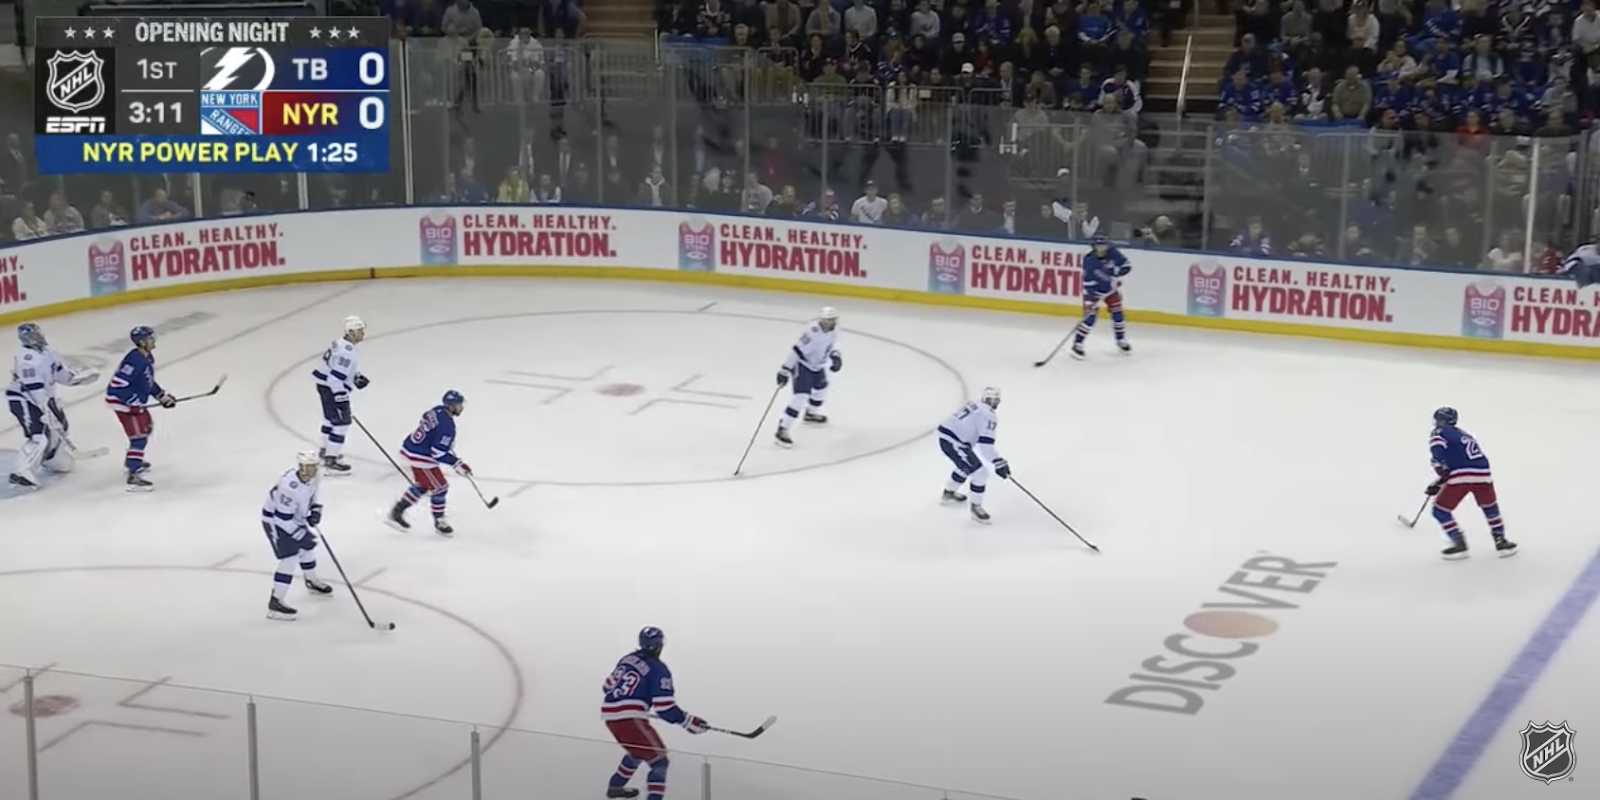
Tampa Bay Lightning vs. New York Rangers - 10/11/2022
Digitally Enhanced Dasherboards
When comparing and contrasting the two different sponsorship activations, three key variables stand out as advantages for the DED:
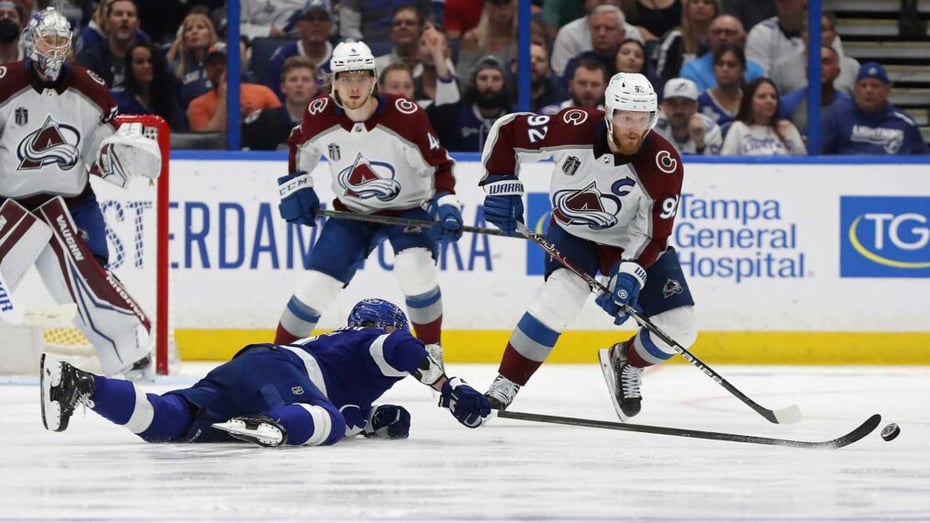
- Clarity of Exposure: While static dasherboards are often blurred and distorted during the fast pace of play, DEDs are clear, legible and prominent, regardless of how quickly the puck is transitioning from one zone to the next. As a result, the overall quality of each DED exposure is higher than that of the static dasherboard.
- Creative Flexibility: DEDs allow for not only the inclusion of a primary brand logo but also supporting product placement and strategic marketing messaging. The integrations deliver more memorable and unique creatives compared to the static dasherboard.
- Drawing the Eyes of Fans: While static sponsors are often cluttered together and splitting time with other brands, the DEDs allow for more comprehensive activations and sponsor takeovers, provide partners the opportunity to own the moment, and generate more value per exposure across broadcast, social and streaming.
DED Activation Strategies
Teams have the option to utilize a variety of different activation strategies for the DED - see below for a full breakdown of each footprint:
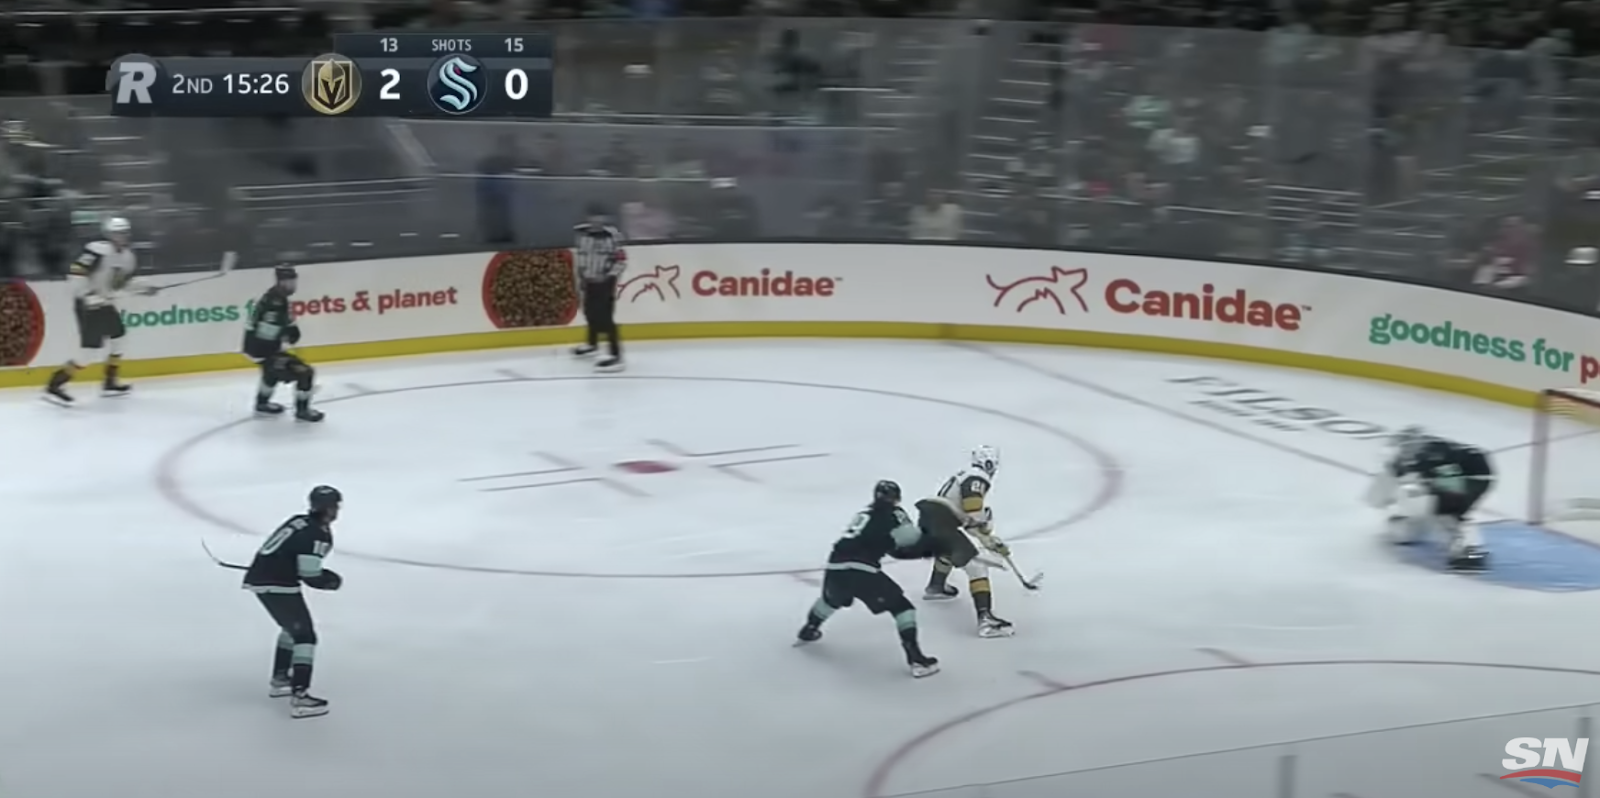
- Full Takeover Integration: A full partner takeover gives a single sponsor the opportunity to own the entirety of the dasherboard space for a 30-second rotation. This strategy is a great way for a particular partner to maximize time and visibility on screen, reduce overall sponsor clutter, and deliver the highest quality exposure. An important consideration for leveraging the full partner takeover strategy is that it limits the number of overall exposures that sponsors can receive throughout the course of a game. That being said, it’s a powerful activation best practice for rewarding marquee and title partners, as showcased by the Seattle Kraken and Canidae below.
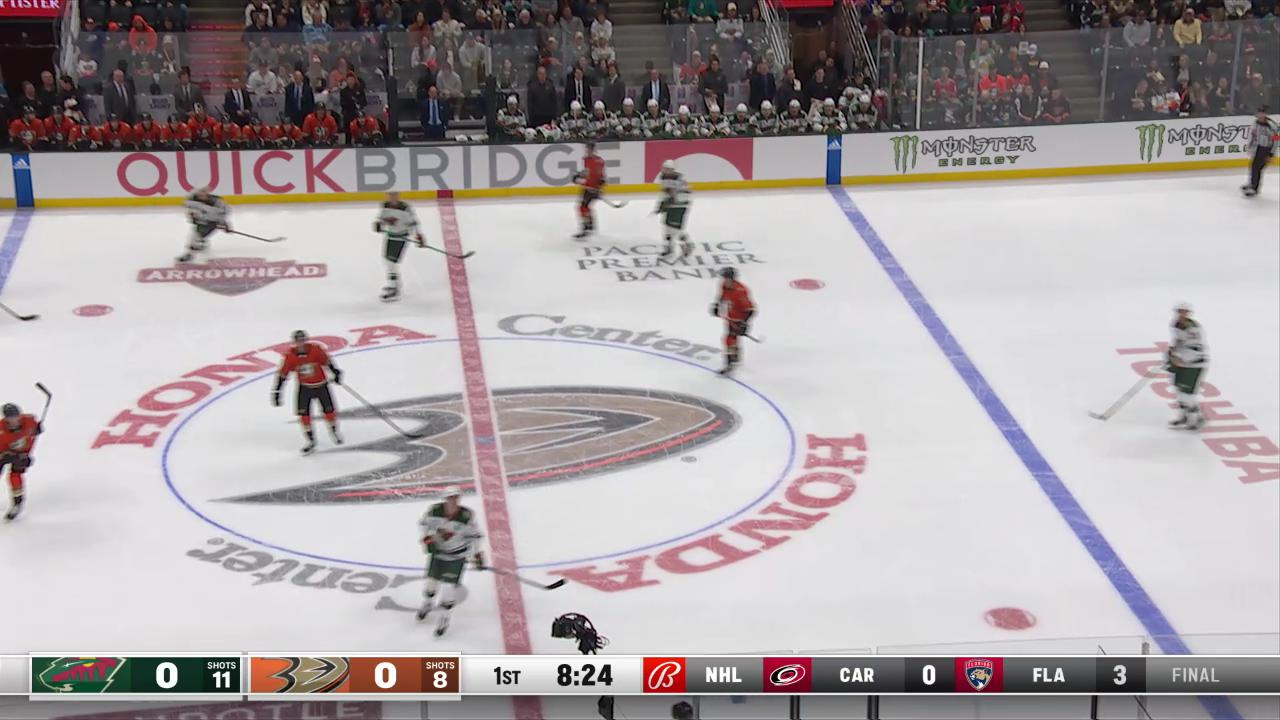
- End Zone Takeover Integration: The end zone takeover allows a team to activate three (3) partners in each DED cycle. This approach offers teams the ability to incorporate more partners into each DED rotation without sacrificing quality. One variable that is important to consider for this strategy is that it is heavily influenced by game-flow - if the puck stays at one end of the rink for an entire DED rotation, there is a chance that certain sponsors do not receive any time on screen. The Anaheim Ducks incorporated this DED approach throughout the season, as seen below with Monster Energy and Quickbridge.
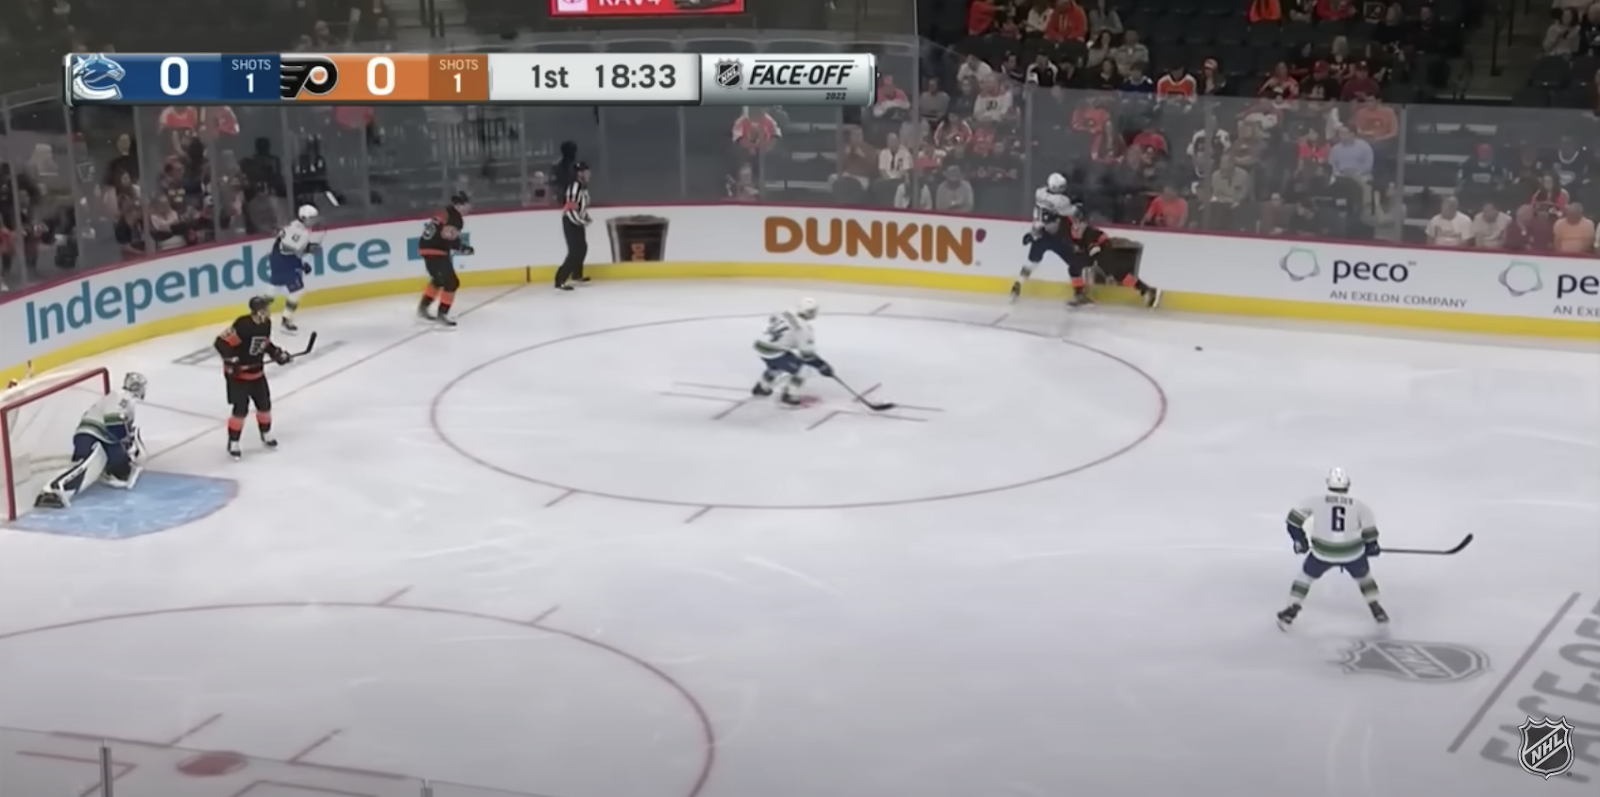
- Split Zone Integration: The split zone integration is the activation that maximizes the number of sponsors in each DED rotation, with up to five (5) sponsors included per rotation. This strategy provides an opportunity to maximize exposures for all partners throughout the course of the game. Additionally, it allows for teams to rotate the positions that partners appear on throughout the rink during the course of a game. However, while the split zone integration delivers more exposure per partner, time on screen and the overall quality of the exposures decreases as more partners are included. The Philadelphia Flyers showcase this integration by featuring Independence, Dunkin’, and PECO Energy in the same rotation.
DEDs are delivering higher quality exposures for NHL team and league partners compared to their static counterparts. However, there are important considerations for all DED activation strategies. It is critical to collaborate with partners on their key goals, objectives, and performance metrics to determine the appropriate activation strategy.
Performance of the DED After the Inaugural Season
Our final section digs into the overall performance of the DED and draws comparisons to the static dasherboard format. Our key quantitative takeaways for the DED are as follows:
- Duration Per Exposure is Higher for DEDs: Regardless of the activation strategy used, the average duration for a sponsor activated on the DED was much higher than the previous static dasherboard format. For teams leveraging a variety of activation footprints, the average duration of a DED exposure is over 10 seconds compared to the 5 second average for the static dasherboard format. With DEDs being visible for longer than the static dasherboard, the innovative asset is more effective for driving brand affinity, promoting specific product lines, and incorporating creative marketing messaging.
- Quality of Exposure is Significantly Higher for DEDs: DEDs outperformed their static counterparts in terms of size, visibility, clarity, prominence, and recognizability. DEDs have a distinct advantage being visible during the fast pace of play. The clarity of DED integrations coupled with the increase in size and strong creative contrast allowed the DED to generate higher overall quality scores for longer amounts of time on screen. More specifically, the average quality score of all DED integrations was 245% higher than the quality scores for Static Dasherboards. Finally, the DED reduces the number of sponsors on screen at any given time, which allows all DED sponsors to deliver higher quality exposures.
- Percentage of Time on Screen is Lower for DEDs: Compared to the static dasherboard format from previous seasons, DEDs were captured in a lower percentage of broadcast frames. While the DEDs delivered longer and higher quality exposures, they were not captured as frequently as static dasherboards. Because the DED is only visible from the main broadcast camera angle, it does not appear as consistently throughout the broadcast.
- Overall Exposure is Lower for DEDs Compared to Previous Static Format: Building on the previous point, static dasherboards had the advantage of being visible from a wider variety of camera angles compared to the DED. As a result, static dasherboards generated a higher quantity of exposure throughout the course of the game. The static dasherboard format delivered more exposure per sponsor per game but the exposures are of lower quality and compete with a higher number of sponsors compared to the DED format.
Key Takeaways & Considerations
DEDs are delivering on improved clarity, visibility, creative flexibility, and quality for NHL teams and league sponsors. After the 2022-23 season, it is clear that DEDs generate consistent and highly visible exposures for sponsors, a major advantage compared to the static dasherboard format. That being said, each DED activation strategy leads to different quantitative and qualitative outcomes - as such, it is important to align with partners on the optimal activation strategy based on strategic objectives and key metrics. Creative execution, brand logo positioning, and leveraging all available activation space will unlock the highest level of value for all DED partners.
We look forward to measuring and monitoring the performance of the DED in the upcoming 2023-24 season.