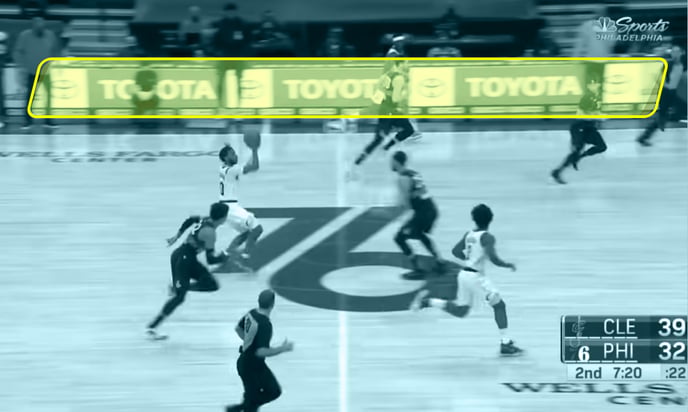
The 2020-21 NBA season was a truly unique season with teams playing a condensed and shortened 72-game schedule in primarily fanless environments. As a result of the pandemic and having limited fans in the stadium, the Sideline Seat Tarps became a key marketing asset to drive value during this season.
Relo Metrics tracked the Sideline Seat Tarps along with other traditional top-performing NBA assets, such as the Basket Stanchion, Apron Signage, Courtside Signage, Floor Court Logo, and Jersey Patch across broadcast and social media for the full NBA regular season (December 22, 2020 - May 16, 2021).
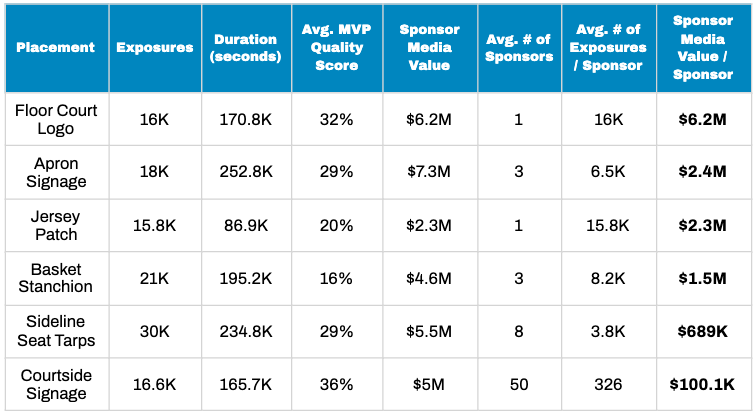
The below tables showcase the total exposures and value that these top-performing sponsor assets generated across broadcast and social media on average for an NBA team.
Top Performing Assets by Sponsor Media Value per Sponsor on Broadcast
Key takeaways and recommendations:
- The Sideline Seat Tarps produced a total of 30K brand exposures, 235K seconds of on-screen brand duration, and $5.5M for each NBA team on broadcast this season.
.jpg?width=688&name=Socia%20Post%203%20(3).jpg)
- On a per sponsor basis, the Floor Court Logo, a premier on-court TV-visible asset (generally owned by the team’s naming rights partner) was the top-performing asset. It produced 16K exposures and $6.2M in SMV per team this season. As an exclusively owned asset, the Floor Court Logo scored high on share of voice and visibility, resulting in a high 32% average Media Value Percentage (MVP) score.
- The Jersey Patch, an exclusive partner asset, ranked 2nd in total exposures per sponsor and delivered an average of $2.3M per team this season on broadcast. However, due to the smaller size of the Jersey Patch and the fact that it was recognizable only during close camera angles (such as during replays or when a player was at the free-throw line) it produced the lowest amount of total exposures, brand duration, and an MVP Score of ~10-15% below several other top performing assets. To counter this, be sure to utilize colors that contrast well with the jersey color or a stacked logo creative to maximize the visibility and clarity of the patch on television.
-1.jpg?width=688&name=Socia%20Post%203%20(3)-1.jpg)
- The Basket Stanchion produced the 2nd highest number of total exposures but had a low MVP score of 16%. While appearing on-screen frequently—especially during dunks or corner 3-point shots—the Basket Stanchion can be obstructed by the backboard and therefore was not fully visible during normal gameplay.
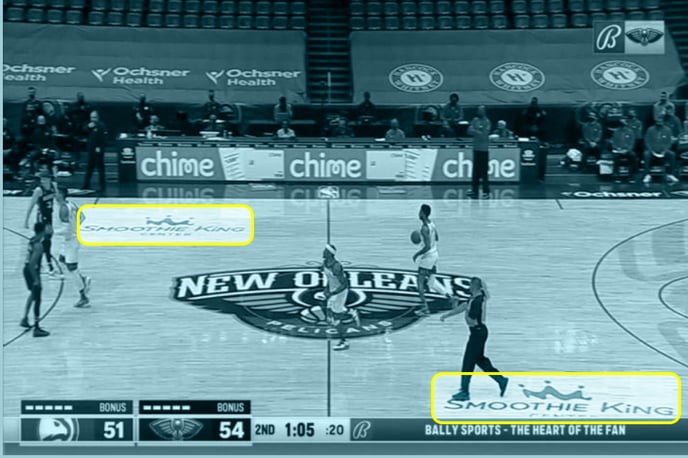
- The Courtside Signage, a rotating LED asset, had an average of 50 sponsors per team and therefore produced a low 326 total exposures per sponsor for the season. A repeating logo pattern creative for this asset would offer optimal performance.
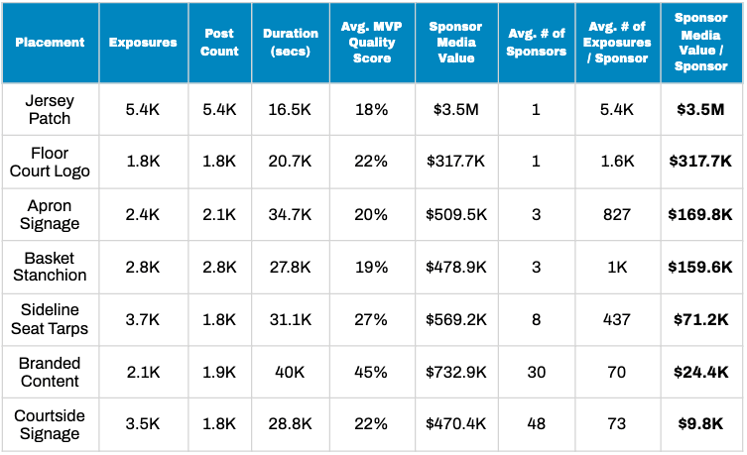
Top Performing Assets by Sponsor Media Value per Sponsor on Social Media
Key takeaways and recommendations:
- Both on a total and per sponsor basis, the Jersey Patch was by far the top-performing asset on social media. Being an exclusive asset, it produced over 3x more exposures per sponsor than any other asset and also produced the highest duration. Moreover, despite having the lowest MVP score, it generated $3.5M on social media, over $3M more sponsor media value (SMV) on a per sponsor basis than any other asset.
- The Sideline Seat Tarps produced 3.7K total exposures—the 2nd highest total number of exposures equating to 437 exposures total per sponsor for the season. Due to the large size and branding of this asset, it also produced the 2nd highest average MVP score.
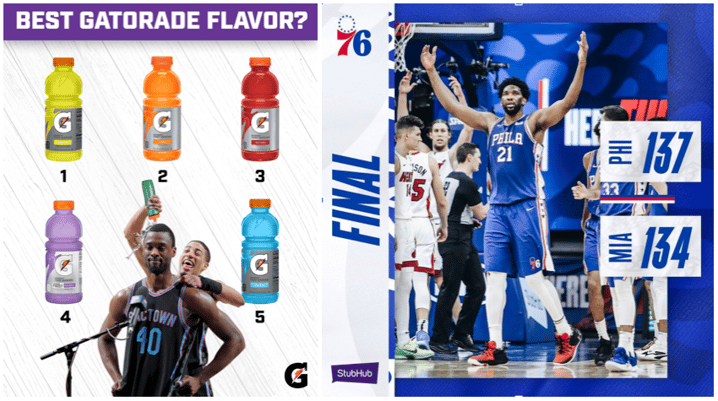
- Branded Content is one of the top-performing assets on social media for teams. On average, each NBA team currently has ~30 Branded Content sponsors and produced 2K total Branded Content posts this season. Being graphic overlays, these kinds of exposures are generally clear, as validated by the high average MVP score of 45%.
- Relo Metrics recommends teams continuing to post more Branded Content posts as it is an effective way to generate guaranteed high-quality exposures for sponsors and drive brand awareness and team affiliation. Top-performing Branded Content posts are often ‘Final Score’ and ‘Gameday’ posts or ones that fans can engage with and should be incorporated into every team’s social content strategy.
The analysis showed that the addition of the Sideline Seat Tarps proved to be a great asset for teams this season as it generated the highest total brand exposures and duration on broadcast and a combined $6.1M in sponsor media value across broadcast and social.
Also, it showed that amongst the top assets in the NBA, in terms of exposures on a per sponsor basis, the Floor Court Logo and the Jersey Patch were the top two performing assets across broadcast and social especially due to their exclusivity.
On broadcast, the Floor Court Logo’s large size and key placement location on the court ensure it gets captured frequently throughout the course of the game.
On social media, content will often include photos of a player showcasing the jersey patch or video highlight clips that will have close-ups of players.
While exposure quantity and duration are key factors in driving value, the quality of the exposures is just as important. For example, although Branded Content is a social-only asset and generates much fewer exposures than the other assets, it is consistently a top-3 performing social asset in terms of total sponsor media value generated due to its high MVP score.
Teams should use the data results from this analysis to be able to make better-informed decisions surrounding their sponsorship assets in order to deliver the most exposure and maximize sponsor media value for their brand partners.
If you're curious about other league insights, check out our analysis on the Tour de France's Top Ranked Assets, or feel free to go directly to our blog post page.
Written by Chris Tran