The 2020-21 NHL season was one of the most unusual seasons in history as the impact of COVID-19 forced the league to shorten the regular season to 56 games and realigned the divisions, placing all seven Canadian teams into one division.
According to the Sports Business Journal, the 2020-21 NHL regular season achieved an average total audience delivery (TAD) of 391,000 viewers across NBC and NBCSN - the lowest recorded during the league’s existing ten-year partnership with NBC.
Without fans in attendance and television viewership down, it became even more important this season for teams to understand the performance of their TV-visible assets in order to optimize and deliver the most value back to their brand partners.
For this analysis, Relo Metrics tracked the top traditional performing NHL assets across broadcast and social media for the full NHL regular season (January 13, 2021 - May 15, 2021).
The below tables show the total exposures and value that these top-performing sponsor assets generated across broadcast and social media on average for an NHL team.
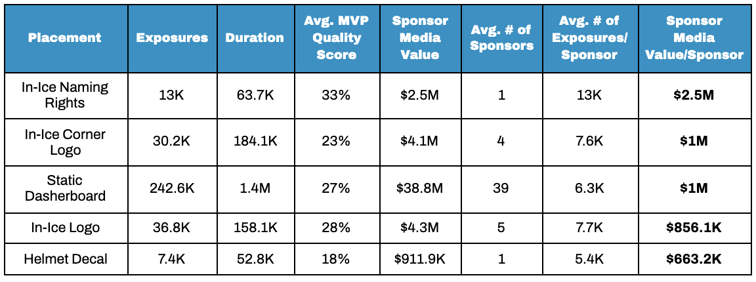
Top Performing Assets by Sponsor Media Value per Sponsor on Broadcast
Key takeaways and recommendations:
- Static Dasherboard (39 sponsors) produced an average total of 243K brand exposures and $38.8M for each NHL team this season. It also produced a 27% MVP score, the 3rd highest amongst these top assets. The best performing Static Dasherboard locations are directly behind the net or on the corners at either end of the ice facing the broadcast camera.
.jpg?width=688&name=Socia%20Post%205%20(4).jpg)
- On a per sponsor basis, the In-Ice Naming Rights was the top performing asset. It produced an average total 13K brand exposures and $2.5M for the team’s stadium naming rights partner. Additionally, as an exclusively owned asset, the logos large size and visibility on the ice and strategically located near center ice resulted in a high 33% average Media Value Percentage (MVP) score.
.jpg?width=685&name=Socia%20Post%205%20(5).jpg)
- The Helmet Decal generated the fewest amount of exposures. Being a small placement, sponsors appearing on the helmet are visible and recognizable only during close camera angles, mostly during replays or when players are on the bench. This also explains the low quality of its exposures, with an 18% average MVP score - around 10-15% lower than some of the other top-performing assets on broadcast.
- Using large bold logos with contrasting colors or utilizing a stacked logo creative would help to maximize the MVP score for this placement.
.jpg?width=688&name=Socia%20Post%205%20(6).jpg)
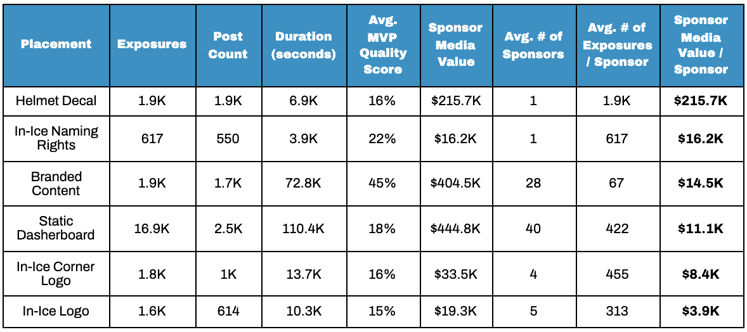
Top Performing Assets by Sponsor Media Value per Sponsor on Social Media
Key takeaways and recommendations:
- The Helmet Decal was by far the top-performing asset on social. It produced an average total 1.9K exposures (4x more exposures per sponsor than any other placement). Social content tends to be close-up photos of players where the Helmet Decal is captured more frequently. Despite having a low MVP score of 16%, it generated $215.7K on social - over $200K more SMV on a per sponsor basis than any other asset.
- While the In-Ice Naming Rights was the top asset on broadcast, on social on a per sponsor basis, it ranked 2nd with 617 exposures $16.2K in sponsor media value. Social videos are often highlights of goals or key plays around the net, where this placement doesn’t get captured as often.
- Branded Content ranked 3rd overall in terms of sponsor media value per sponsor. On average, each NHL team produced 1.7K branded content posts for 28 partners resulting in an average of $14.5K in SMV for each sponsor.
- While the number of exposures for each partner is low, Branded Content posts are averaging a 45% MVP score (20% higher than any other placement). To increase the MVP score for branded content posts, use contrasting colors (dark logo color on white background), maximize the size of the logo, and position the logo close to the center of the image where the viewer’s attention is drawn to.
The analysis showed that on broadcast the Static Dashberboard asset was by far the top-performing placement, producing $30M more in total sponsor media value than any other placement. On social, the new Helmet Decal asset was a highly valuable asset for teams this season as it generated the highest total number of brand exposures and sponsor media value.
Other new assets such as the Leading Edge Wrap and Virtual placements also performed very well this season. In particular, the Leading Edge Wrap and Slot In-Ice placements performed well across both broadcast and social.
Looking ahead, with the potential of the NHL introducing jersey patch sponsorships as early as the 2022-23 season, now is the time to work with Relo Metrics and leverage our white-space analysis capabilities to effectively track and demonstrate the potential value of these new sponsor assets.
You can learn more here about Relo Metrics' white-space analysis.
If you're curious about other league insights, check out our analysis on the NBA Regular Season -Top Ranked Assets, or feel free to go directly to our blog post page.
Written by Chris Tran